Hippo's data
EDA 자동화 툴 (AutoViz / Sweetviz / Pandas Profiling) 본문
안녕하세욥 오늘은 EDA (Exploratory Data Analysis)를 도와주는 여러가지 라이브러리에 대해 소개해보겠씁니당!
항상 본격적인 데이터분석에 앞서 EDA가 진짜 중요하다고들 하는데욥 특히 캐글이나 데이콘과 같은 분석 대회에서도 상위권 유저들의 EDA를 통해 도출한 분석 및 모델링 전략들은 정말 대단하도라구요,,,,
그렇다면 EDA (Exploratory Data Analysis)가 무엇일까요?
한국어로는 탐색적 데이터 분석이라고 하는데욥 단어 그대로 데이터를 탐색하는 과정이라고 할 수 있습니다!
즉, 데이터를 시각화하거나 통계량을 통해서 분포, 관계를 파악하며 데이터가 어떻게 생겼는지 파악하는 단계라고 할 수 있는데요!
근데 처음에는 어떤 그래프를 그리고 어떤 통계량을 살펴볼지 잘 모르겠고 귀찮거나 확신이 들지 않는다면,
EDA를 도와주는 자동화 라이브러리를 사용해보는 것도 좋은 전략입니다!
간단한 몇줄의 코드만으로 EDA를 진행할 수 있는데욥
EDA 자동화 라이브러리에는 여러가지가 있는데욥 그 중 3가지를 알아보겠습니다!
1. AutoViz
2. Sweetviz
3. Pandas Profiling
+ 실제 데이터 분석 경진대회 플랫폼인 데이콘 대회 데이터를 이용하여 자동화 툴을 이용해 보겠습니다!
전기차 가격 예측 해커톤: 데이터로 EV를 읽다! (2024.12.02 ~ 2025.01.31)
https://dacon.io/competitions/official/236424/data
전기차 가격 예측 해커톤: 데이터로 EV를 읽다! - DACON
분석시각화 대회 코드 공유 게시물은 내용 확인 후 좋아요(투표) 가능합니다.
dacon.io
1. AutoViz
https://github.com/AutoViML/AutoViz
GitHub - AutoViML/AutoViz: Automatically Visualize any dataset, any size with a single line of code. Created by Ram Seshadri. C
Automatically Visualize any dataset, any size with a single line of code. Created by Ram Seshadri. Collaborators Welcome. Permission Granted upon Request. - AutoViML/AutoViz
github.com
# 설치 및 불러오기
# AutoViz 객체 생성
# 데이터 시각화
filename= 파일경로
sep = 파일의 구분자(기본값 -> 쉼표(,))
dfte = 데이터 프레임 직접 전달할 때
depVar = 종속변수
verbose = 출력 수준 ( 0은 최소 출력, 1은 중간 출력, 2는 최대 출력 )
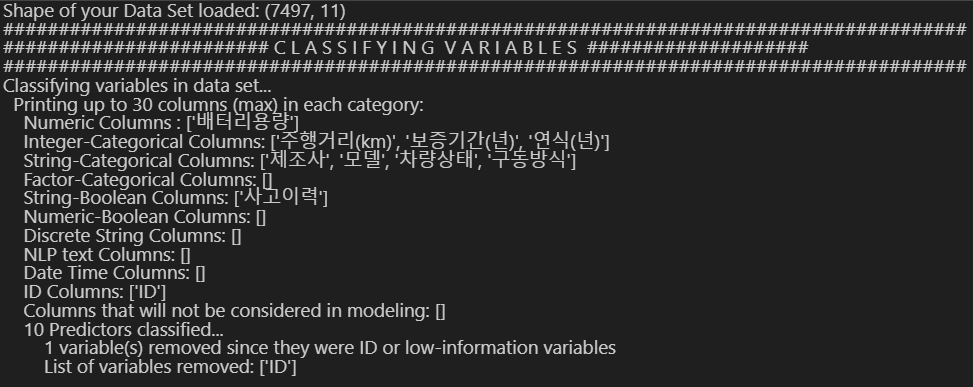
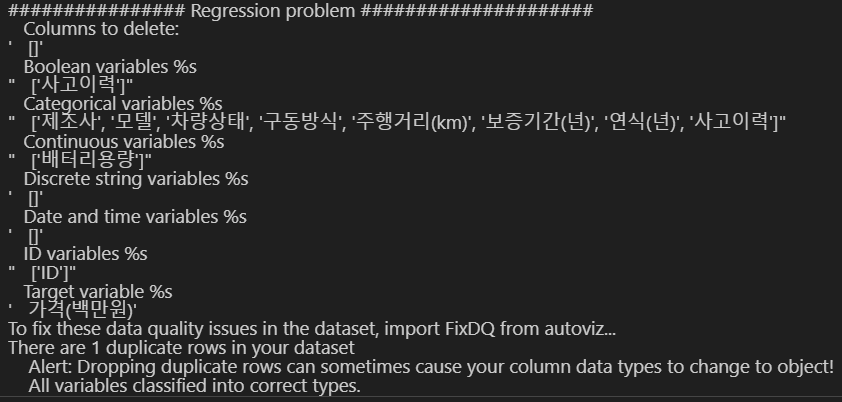
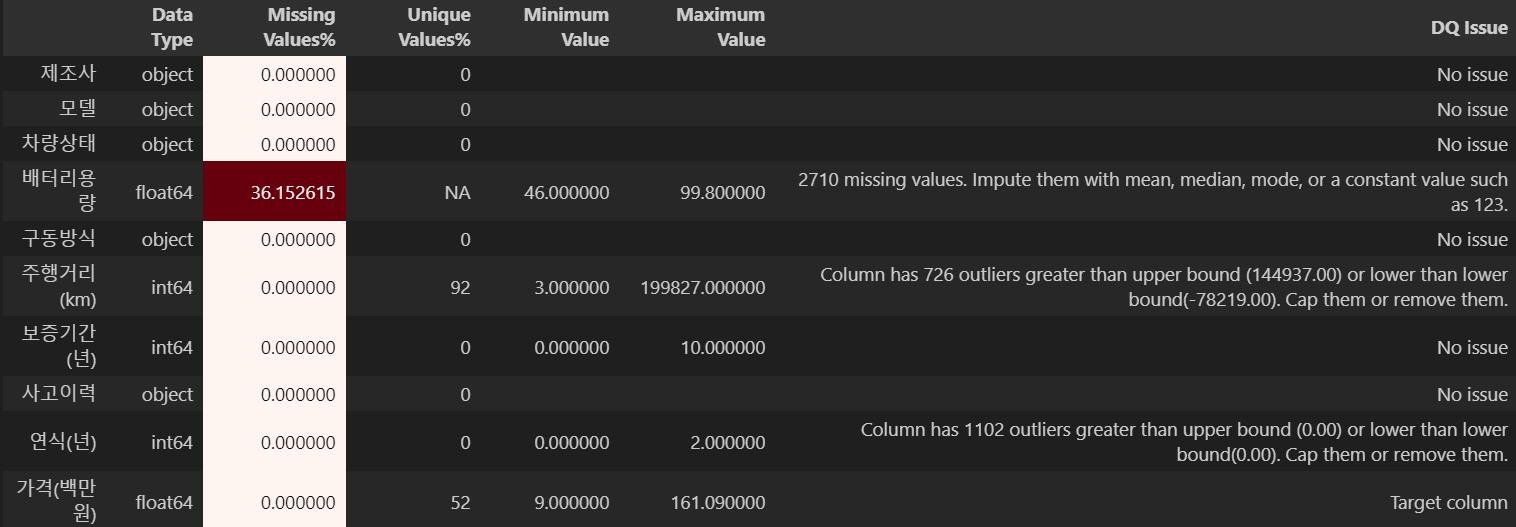
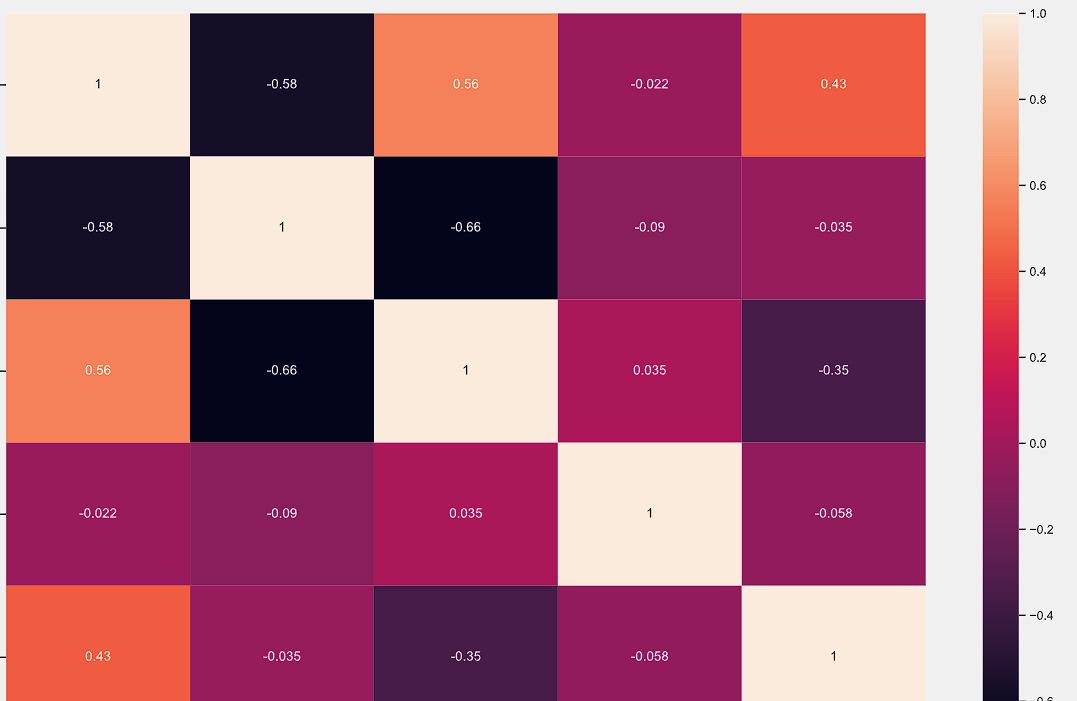
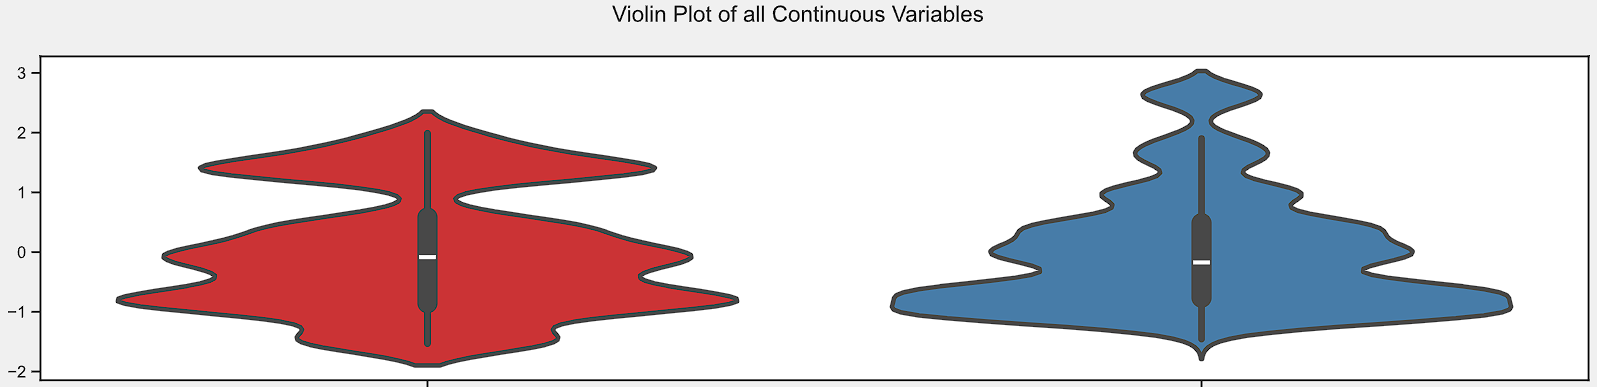
-> 데이터셋 크기, 변수 유형 분류(수치형, 범주형, 이산형 등등) , 각 변수의 특징( 결측값, 최소최대, 유니크 값) 등을 확인할 수 있습니다! + 다양한 그래프 시각화 결과(스캐터 플랏, 히트맷, 바이로린 플랏 등)를 파일에 저장해 줍니다!
# 유용한 자료
https://towardsdatascience.com/autoviz-a-new-tool-for-automated-visualization-ec9c1744a6ad
AutoViz: A New Tool for Automated Visualization
An Exploration of Effective Automatic Data Analysis
towardsdatascience.com
https://github.com/danroth-nyt/autoviz_test/blob/master/AutoViz_test.ipynb
autoviz_test/AutoViz_test.ipynb at master · danroth-nyt/autoviz_test
A repository for testing the AutoViz library. Contribute to danroth-nyt/autoviz_test development by creating an account on GitHub.
github.com
https://www.kaggle.com/code/gvyshnya/automating-eda-and-feature-importance-detection
Automating EDA and Feature Importance Detection
Explore and run machine learning code with Kaggle Notebooks | Using data from Mechanisms of Action (MoA) Prediction
www.kaggle.com
2. Sweetviz
https://github.com/fbdesignpro/sweetviz
GitHub - fbdesignpro/sweetviz: Visualize and compare datasets, target values and associations, with one line of code.
Visualize and compare datasets, target values and associations, with one line of code. - fbdesignpro/sweetviz
github.com
# 설치 및 불러오기
# Sweetviz 분석 수행

# 보고서 생성 및 저장
생성된 보고서가 html로 저장됩니다!
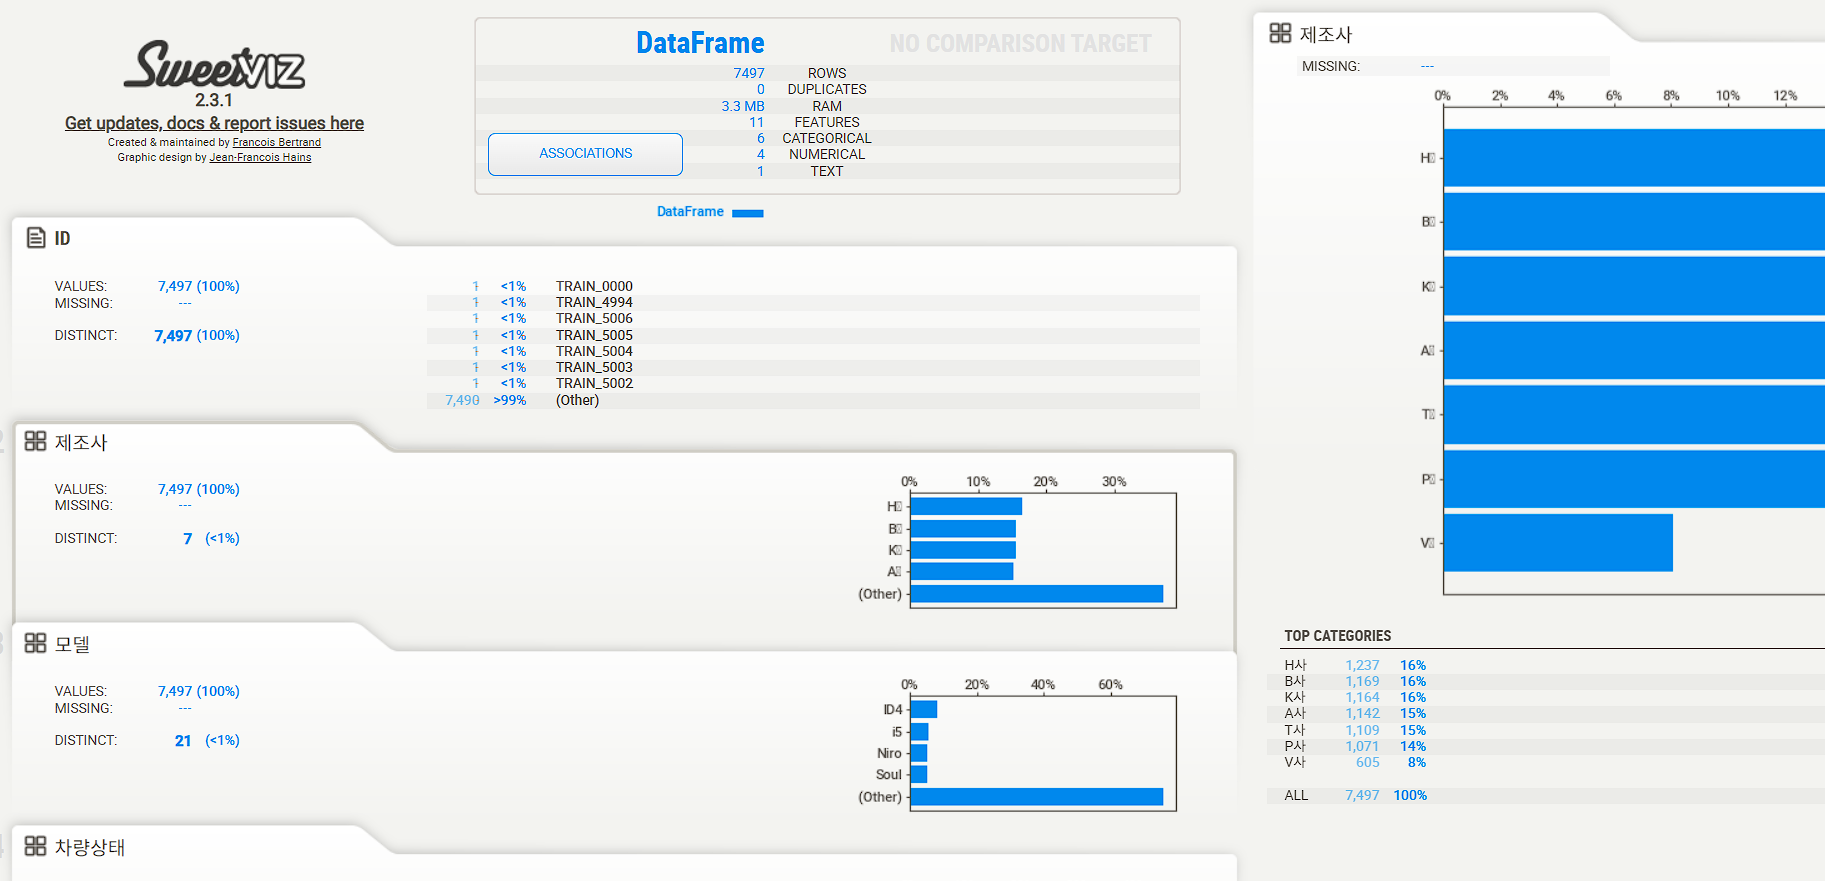
각 변수별 특징(분포, 결측값, 유니크 값 등), 상관관계 등을 확인할 수 있습니다!
특히 클릭 버튼으로 확인가능한 인터렉티브한 보고서가 생성됩니답
# 유용한 자료
sweetviz 튜토리얼
Powerful EDA (Exploratory Data Analysis) in just two lines of code using Sweetviz
Get to know your data much quicker with this new Python library
towardsdatascience.com
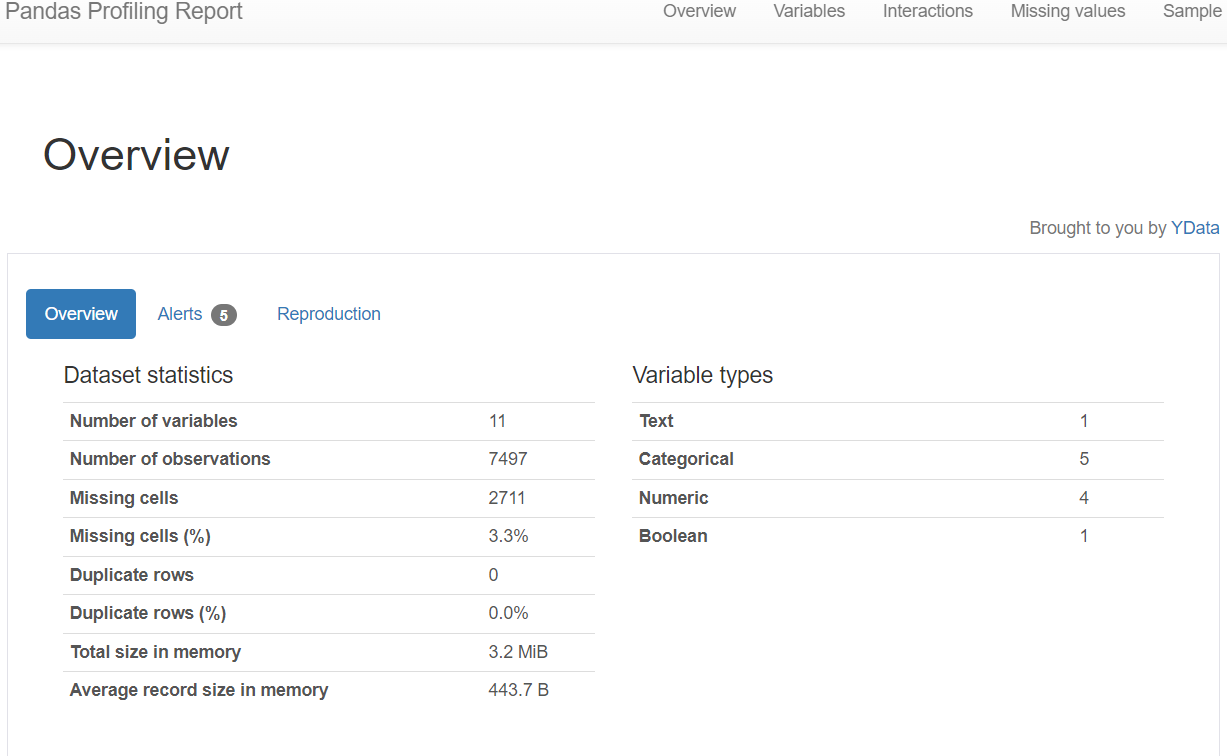
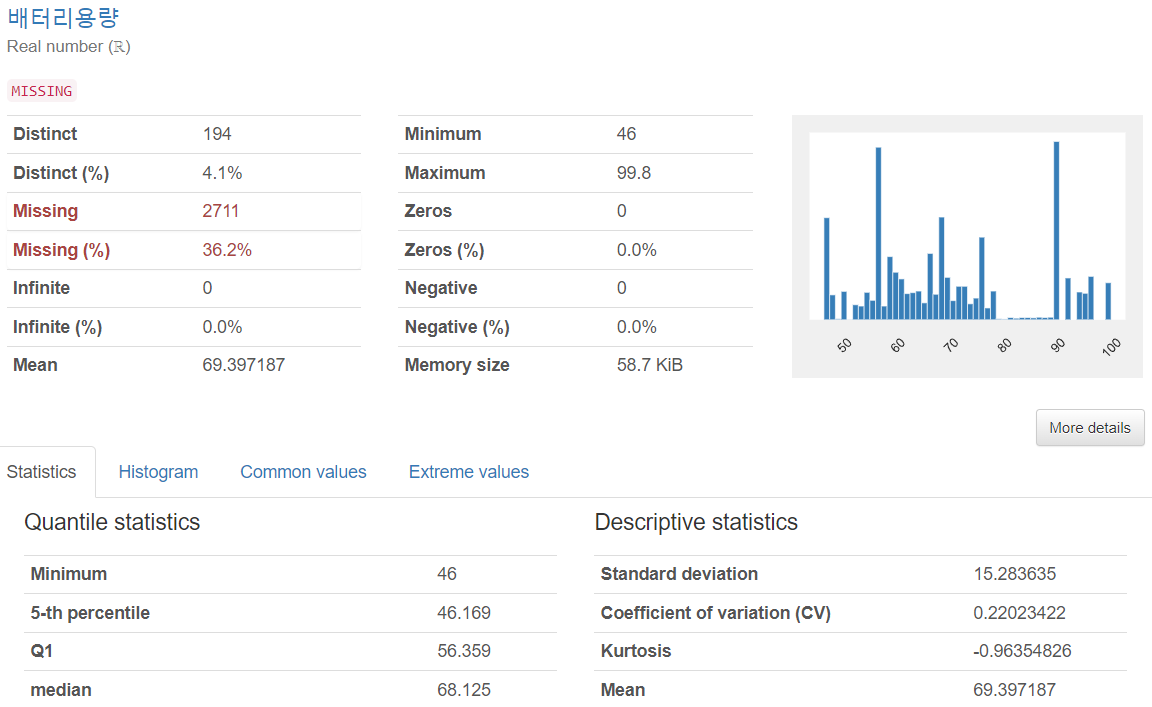
3. Pandas Profiling
판다스 프로파일링은 기술통계학, 시각화에 조금 더 치중되어 있습니답
https://hipposdata.tistory.com/98
pandas_profiling(판다스 프로파일링) 활용하기
데이터분석을 할 때, EDA (Exploratory Data Analysis) 탐색적 데이터 분석은 필수적인 과정이죠! 그렇다면 EDA란 무엇일까요? 즉, 여러 그래프를 그려보거나 여러 통계를 찍어보는 등 데이터를 여러 각
hipposdata.tistory.com
Pandas Profiling도 sweetviz와 마찬가지로 인터렉티브한 보고서를 만들어 줍니다!
'Info' 카테고리의 다른 글
| pandas_profiling(판다스 프로파일링) 활용하기 (0) | 2024.08.12 |
|---|---|
| 깃허브 코파일럿 학생인증 (Github Copilot Student) (2) | 2024.03.23 |
| 구글 검색(구글링googling) 하는 법 (0) | 2024.02.06 |


